Mastering AWS CloudWatch Application Signals with OpenTelemetry
AWS CloudWatch Application Signals is a powerful observability feature that automatically monitors the performance of your applications and helps you quickly identify issues. In this guide, we will explore step-by-step how to integrate Application Signals using OpenTelemetry (OTel).
Table of Contents
- Introduction
- What is CloudWatch Application Signals?
- Why OpenTelemetry?
- Architecture and How It Works
- Step-by-Step Setup Guide
- Frequently Asked Questions (FAQ)
- Conclusion
Introduction <a name="introduction"></a>
In modern microservices architectures, understanding the health of your application can be challenging. Observability is critical for tracing errors in distributed systems, finding bottlenecks, and improving user experience. AWS CloudWatch Application Signals is designed to meet this need.
What is CloudWatch Application Signals? <a name="what-is-cloudwatch-application-signals"></a>
CloudWatch Application Signals automatically monitors application performance (error rate, latency, request count) on a per-service basis. It offers you:
- Automated Service Map: Visualizes how your services communicate with each other.
- Service Level Objectives (SLO): Allows you to define performance metrics aligned with business goals.
- X-Ray Integration: Facilitates root cause analysis using trace data.
Why OpenTelemetry? <a name="why-opentelemetry"></a>
OpenTelemetry (OTel) is an open-source project that has become the industry standard for collecting observability data (logs, metrics, traces). AWS CloudWatch works seamlessly with OTel.
- Vendor Agnostic: You are not locked into a single provider.
- Rich Ecosystem: Offers ready-to-use libraries for many languages and frameworks.
- Flexibility: Once data is collected, you can send it to multiple destinations (CloudWatch, Prometheus, etc.).
Architecture and How It Works <a name="architecture-and-how-it-works"></a>
The diagram below shows how the OpenTelemetry Collector and CloudWatch Application Signals work together.
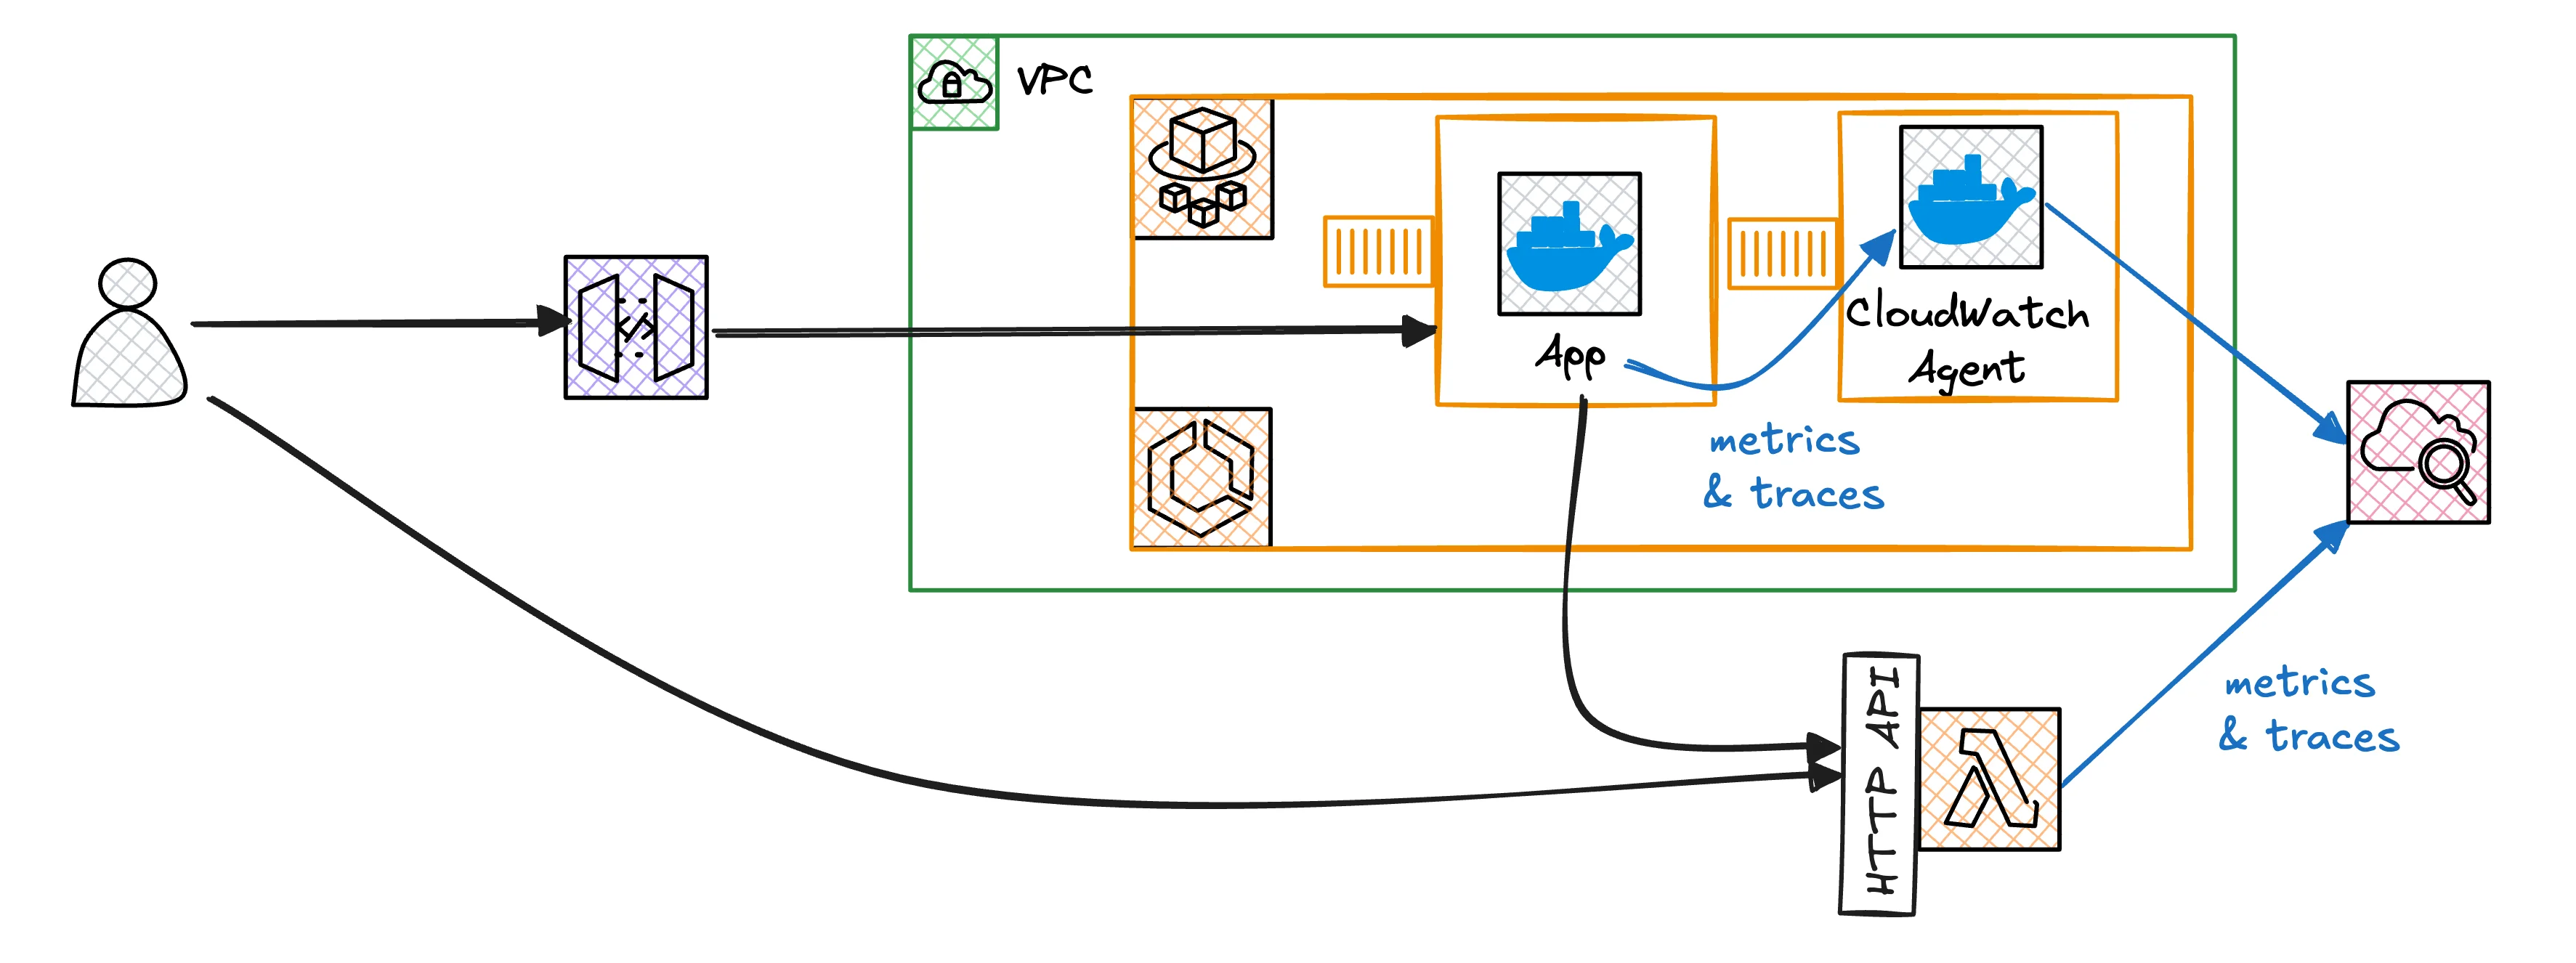
Your application (Java, Python, Node.js, etc.) is instrumented with the OTel SDK. Data is sent to the ADOT (AWS Distro for OpenTelemetry) Collector and then forwarded to CloudWatch.
Step-by-Step Setup Guide <a name="step-by-step-setup-guide"></a>
In this section, we will see how to connect a simple Java application to CloudWatch Application Signals using OpenTelemetry.
Prerequisites
- AWS Account
- AWS CLI installed and configured
- Kubernetes (EKS) or ECS cluster (Example is based on EKS)
kubectlandhelmtools
Step 1: Install ADOT Add-on
Install the AWS Distro for OpenTelemetry (ADOT) operator on your EKS cluster.
# Installing ADOT as an EKS Add-on
aws eks create-addon --cluster-name my-cluster --addon-name adot --addon-version v0.88.0-eksbuild.1
Step 2: Configure OpenTelemetry Collector
Create a Collector configuration (YAML) to send data to CloudWatch. Remember to enable the application_signals feature.
apiVersion: opentelemetry.io/v1alpha1
kind: OpenTelemetryCollector
metadata:
  name: my-collector
spec:
  mode: daemonset
  config: |
    receivers:
      otlp:
        protocols:
          grpc:
          http:
    processors:
      resourcedetection:
        detectors: [aws_eks]
      batch:
    exporters:
      awscloudwatch:
        region: us-east-1
        logs:
          log_group_name: "/aws/containerinsights/my-cluster/application"
          log_stream_name: "application-signals"
    service:
      pipelines:
        traces:
          receivers: [otlp]
          processors: [resourcedetection, batch]
          exporters: [awscloudwatch]
        metrics:
          receivers: [otlp]
          processors: [resourcedetection, batch]
          exporters: [awscloudwatch]
Apply this configuration:
kubectl apply -f collector-config.yaml
Step 3: Instrument Your Application
You can use auto-instrumentation for your Java application. Add the necessary environment variables to your Dockerfile or Kubernetes deployment file.
env:
  - name: OTEL_RESOURCE_ATTRIBUTES
    value: "service.name=my-java-service,service.namespace=production"
  - name: OTEL_TRACES_EXPORTER
    value: "otlp"
  - name: OTEL_METRICS_EXPORTER
    value: "otlp"
  - name: OTEL_EXPORTER_OTLP_ENDPOINT
    value: "http://my-collector-collector:4317"
Frequently Asked Questions (FAQ) <a name="frequently-asked-questions"></a>
1. Is CloudWatch Application Signals free?
Yes, usage of Application Signals is subject to standard CloudWatch metrics and X-Ray tracing charges. However, the automated analysis capabilities it provides can reduce your operational costs.
2. Which languages are supported?
Most languages with an OpenTelemetry SDK are supported, including Java, Python, Node.js, and .NET. AWS provides specialized auto-instrumentation agents for Java and Python.
3. Does it work with my existing X-Ray setup?
Yes, Application Signals integrates with X-Ray. It enriches your existing X-Ray traces to add features like service maps and SLO tracking.
4. Why should I use Application Signals?
You should use it to monitor the health of your services "out-of-the-box" and perform automatic anomaly detection, rather than building manual dashboards.
Conclusion <a name="conclusion"></a>
The integration of CloudWatch Application Signals and OpenTelemetry offers a robust observability solution for modern applications. By combining standards-based (OTel) data collection with AWS's advanced analytics capabilities, you can increase the reliability of your systems.
For more information, you can check the AWS CloudWatch Documentation and the OpenTelemetry Official Site.