Create AWS Diagrams with Kiro: The AI-Powered Way
Create AWS Diagrams with Kiro: The AI-Powered Way
A short while ago, I explored creating AWS diagrams using Python and Amazon Q Developer in the CLI. Following that, I received an interesting question: "Have you tried doing this with Kiro?"
Kiro is an AI-powered IDE from AWS, and when combined with the AWS Diagram MCP (Model Context Protocol), it opens up new possibilities for visualizing your infrastructure. In this guide, I'll walk you through setting up Kiro and using it to generate Diagrams efficiently.
Setting Up Your Environment
To get started, you'll need to set up a few things. First, download and install Kiro from kiro.dev.
Note: At the time of writing, access to Kiro might be waitlisted.
Next, you need to install the dependencies for the Diagrams library, specifically Graphviz. If you are on a Mac, you can install it via Homebrew:
brew install graphviz
For other operating systems, refer to the official Graphviz installation guide.
Configuring the AWS Diagram MCP
Before configuring Kiro, we need the configuration for the AWS Diagram MCP Server. The official configuration is available here.
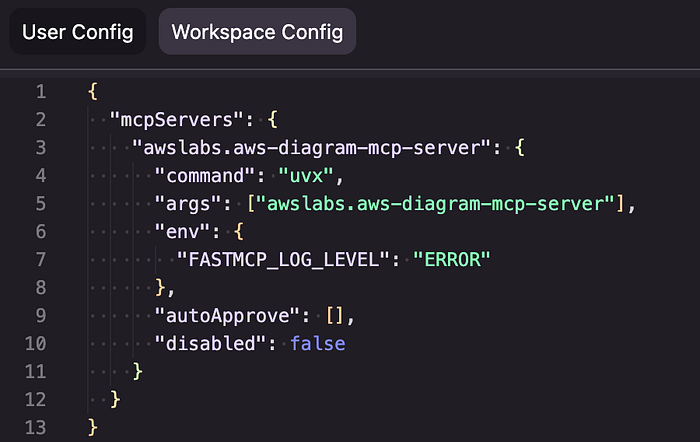
The JSON configuration looks like this:
{
  "mcpServers": {
    "awslabs.aws-diagram-mcp-server": {
      "command": "uvx",
      "args": ["awslabs.aws-diagram-mcp-server"],
      "env": {
        "FASTMCP_LOG_LEVEL": "ERROR"
      },
      "autoApprove": [],
      "disabled": false
    }
  }
}
Configuring Kiro Workspace
- Open Kiro and select your project (e.g., a Terraform module).
- Click on the Kiro logo in the left menu bar.
- Navigate to MCP Servers and click to edit.
- Select Workspace Config and paste the JSON configuration above.
Once saved, awslabs.aws-diagram-mcp-server should appear in your MCP Servers list. You can optionally test the tool by clicking on generate_diagram, which will prompt Kiro to run a test generation.
Building the Diagram
Now for the fun part. You can simply prompt Kiro:
"Can you create an AWS Diagram from the Terraform Module we are currently in?"
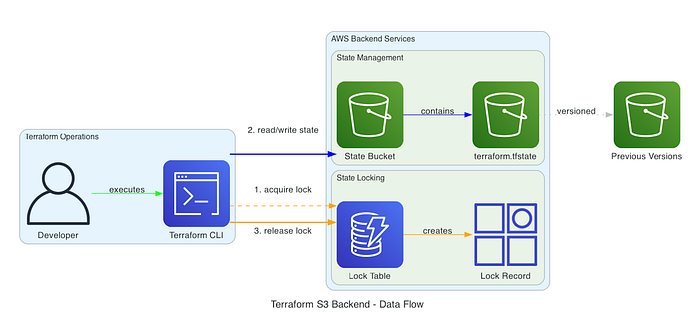
Kiro will analyze your code and generate the diagram using the Python Diagrams library. Unlike manual setups, Kiro handles the context well, though you might encounter minor quirks like files being generated in /tmp/. If that happens, just ask Kiro to move the file to your current workspace.
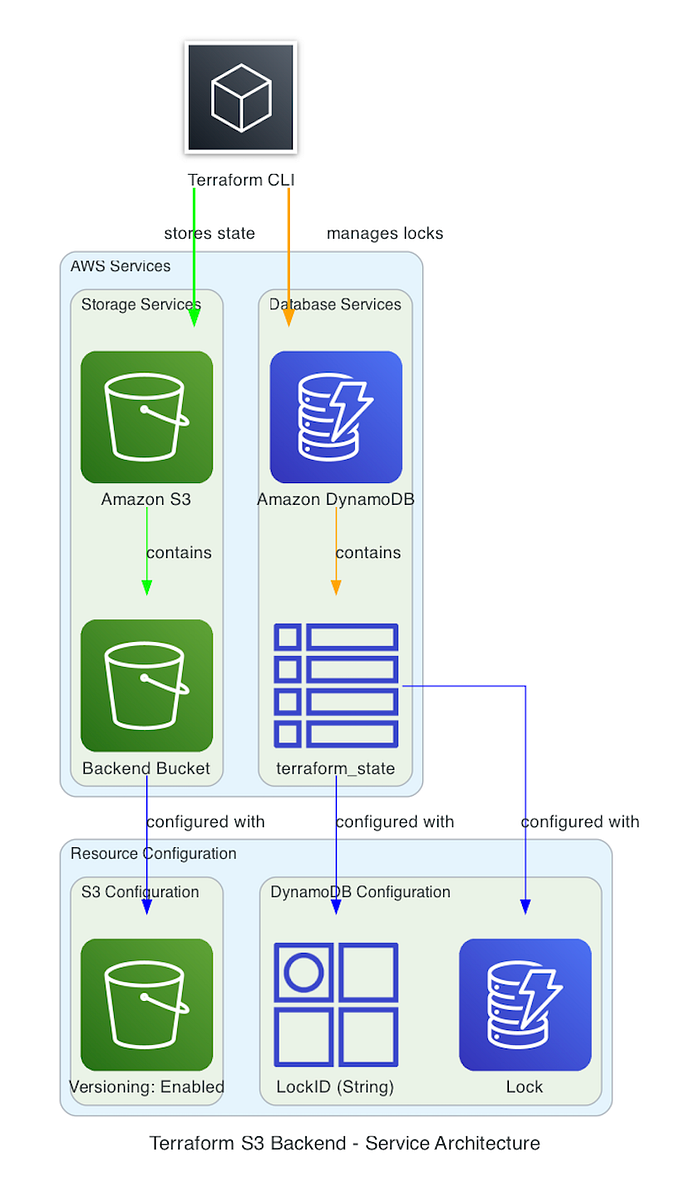
The Generated Code
Kiro generates Python code to render the diagram. Note that the raw code might miss some imports if Kiro is strictly following the MCP guide to focus on logic. You can easily ask Kiro to fix the imports if you need to run the script manually.
with Diagram("Terraform S3 Backend", show=False):
    s3 = S3("Backend Bucket")
    dynamo = Dynamodb("Lock Table")
    s3 >> dynamo
Using MCP with Amazon Q Developer
The same AWS Diagram MCP can be used with Amazon Q Developer. You simply need to add the same JSON configuration to ~/.aws/amazonq/mcp.json (for global use) or .amazonq/mcp.json (for workspace use).
Verify it with:
qchat mcp list
You should see awslabs.aws-diagram-mcp-server listed.
Final Thoughts
Using the AWS Diagram MCP with Kiro or Amazon Q Developer significantly streamlines the process of documenting DevOps architectures. While there are still minor friction points—like file locations or import nuances—the ability to generate visual representations of your Infrastructure as Code (IaC) is a game changer.
Whether you are using Kubernetes, EKS, Docker, or Jenkins, visualizing your stack helps in better communication and documentation.